Case Studies
Case Studies
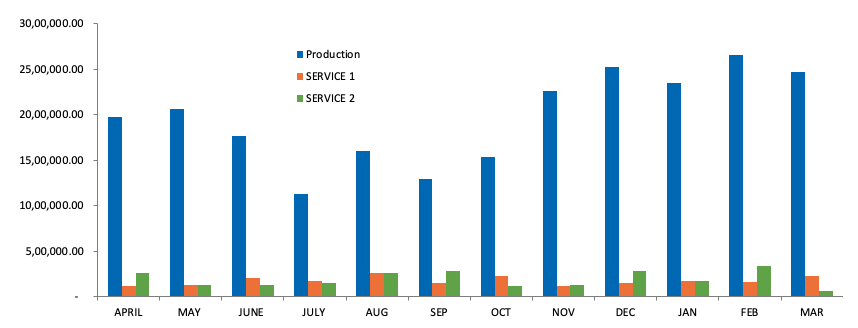
This Graph is result of the our engagement with the client from Aug 23
Boosted Employee Engagement:
Fostered a motivated and dynamic workforce through strategic initiatives.Cultivated Ownership:
Empowered employees to take responsibility and pride in their roles.Daily Morning Meetings:
Established consistent, short meetings to kick-start the day with focus and alignment.Structured Weekly Meetings:
Held regular check-ins to track progress, address challenges, and maintain momentum.Comprehensive Monthly Scorecard Reviews:
Evaluated performance metrics to ensure continuous improvement and transparency.Accountability and Responsibility Awareness:
Promoted a culture of accountability, leading to increased productivity and commitment
Month wise Production Report 2023 - 24
| Particulars |
APRIL |
MAY |
JUNE |
JULY |
AUG |
SEP |
OCT |
NOV |
DEC |
JAN |
FEB |
MAR |
TOTAL |
| Production |
19,69,943.50 |
20,63,323.00 |
17,68,666.00 |
11,28,325.00 |
15,98,958.00 |
12,87,164.00 |
15,30,676.00 |
22,59,305.00 |
25,23,491.77 |
23,47,090.00 |
26,54,275.00 |
24,67,161.00 |
2,35,98,378.27 |
| SERVICE 1 |
1,20,850.00 |
1,24,540.00 |
2,03,940.00 |
1,68,929.00 |
2,62,074.00 |
1,47,655.00 |
2,29,859.00 |
1,13,347.00 |
1,46,585.00 |
1,68,350.00 |
1,60,510.00 |
2,23,230.00 |
20,69,869.00 |
| SERVICE 2 |
2,57,031.00 |
1,27,884.00 |
1,26,255.00 |
1,48,064.00 |
2,53,641.00 |
2,77,930.00 |
1,19,840.00 |
1,22,730.00 |
2,78,030.00 |
1,67,385.00 |
3,40,985.00 |
65,220.00 |
22,84,995.00 |
| TOTAL |
23,47,824.50 |
23,15,747.00 |
20,98,861.00 |
14,45,318.00 |
21,14,673.00 |
17,12,749.00 |
18,80,375.00 |
24,95,382.00 |
29,48,106.77 |
26,82,825.00 |
31,55,770.00 |
27,55,611.00 |
2,79,53,242.27 |
Gems Presentation Worksheet ->
Training Feedback
1. Visibility and Ownership
- Increased visibility of tasks and ownership.
- Greater awareness of individual responsibilities.
2. Accountability and Quality:
- Enhanced accountability among team members.
- Reduction in final rejection rates from 6% to 2%.
3. Responsibility and Communication:
- Workers are taking more responsibility in their roles.
- Improved interaction and communication between team members.
- Narrowed communication gaps during Service Level Agreement discussions.
4. Team Dynamics:
- Improved teamwork and collaboration.
- Initiation of idea generation within teams.
5. Operational Efficiency:
- Machine uptime has improved due to morning meetings.
- Increased adherence to ABSA system and processes.
- Reduced setup times and focused efforts on cycle time reduction.
- A systematic approach towards SOP-driven work.
6. Skill Development and Continuous Improvement:
- Adoption of a learning mindset among workers due to multi skilling chart visibility.
- Implementation of one-page lessons to facilitate continuous improvement.
Production Capacity and Productivity Improvement
1. Understanding Bottleneck:
- Identified critical bottlenecks in the production process.
2. Skill Set Analysis and Introduction of Robo Cell:
- Introduced the first robo cell in control panels manufacturing.
- Reduced dependency on skilled manpower.
3. Time Study and Production Increase:
- Conducted a detailed time study.
- Increased assembly production from 100 units per day to 300 units per day.
- Improved output per man.(almost doubled)
4. Client Satisfaction and Future Plans:
- Client's customer was extremely happy with the improvements.
- Two new product lines are currently under discussion.